How it
works
A Wellometry cycle runs end to end without you chasing anyone. You set the organisation up once, the survey goes out on schedule, and the platform returns scores, department comparisons, a risk read and a written report.
■ 01. Set up
Create your organisation and load your people.
Add your departments, then upload your employee list by CSV or enter it by hand. Departments are the unit everything else reports against, so this is the only structural decision you make.
■ 02. The survey goes out
Everyone is invited, every cycle.
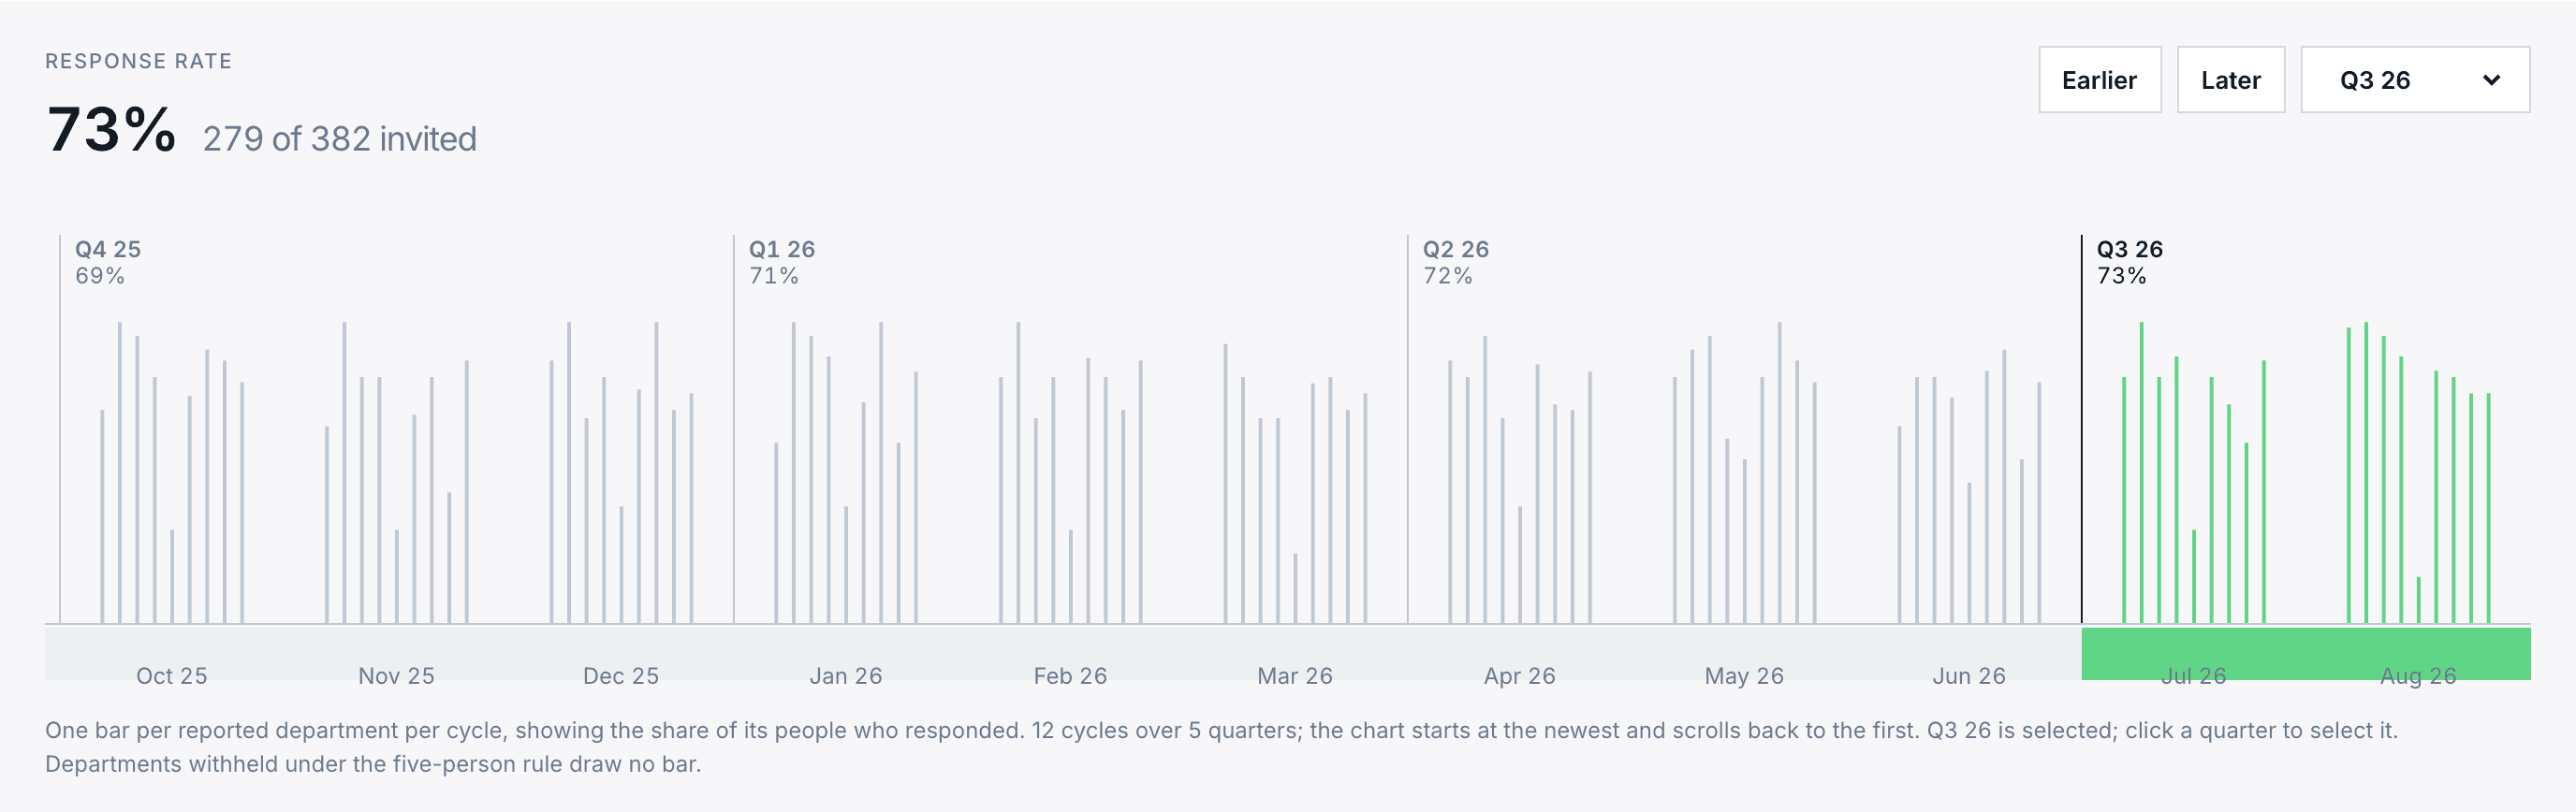
Employees receive an anonymous link by email every 30 days, from the day you start. You watch the response rate build, quarter by quarter, and anyone who has not answered gets one automatic reminder after 7 days.
■ 03. Anonymity
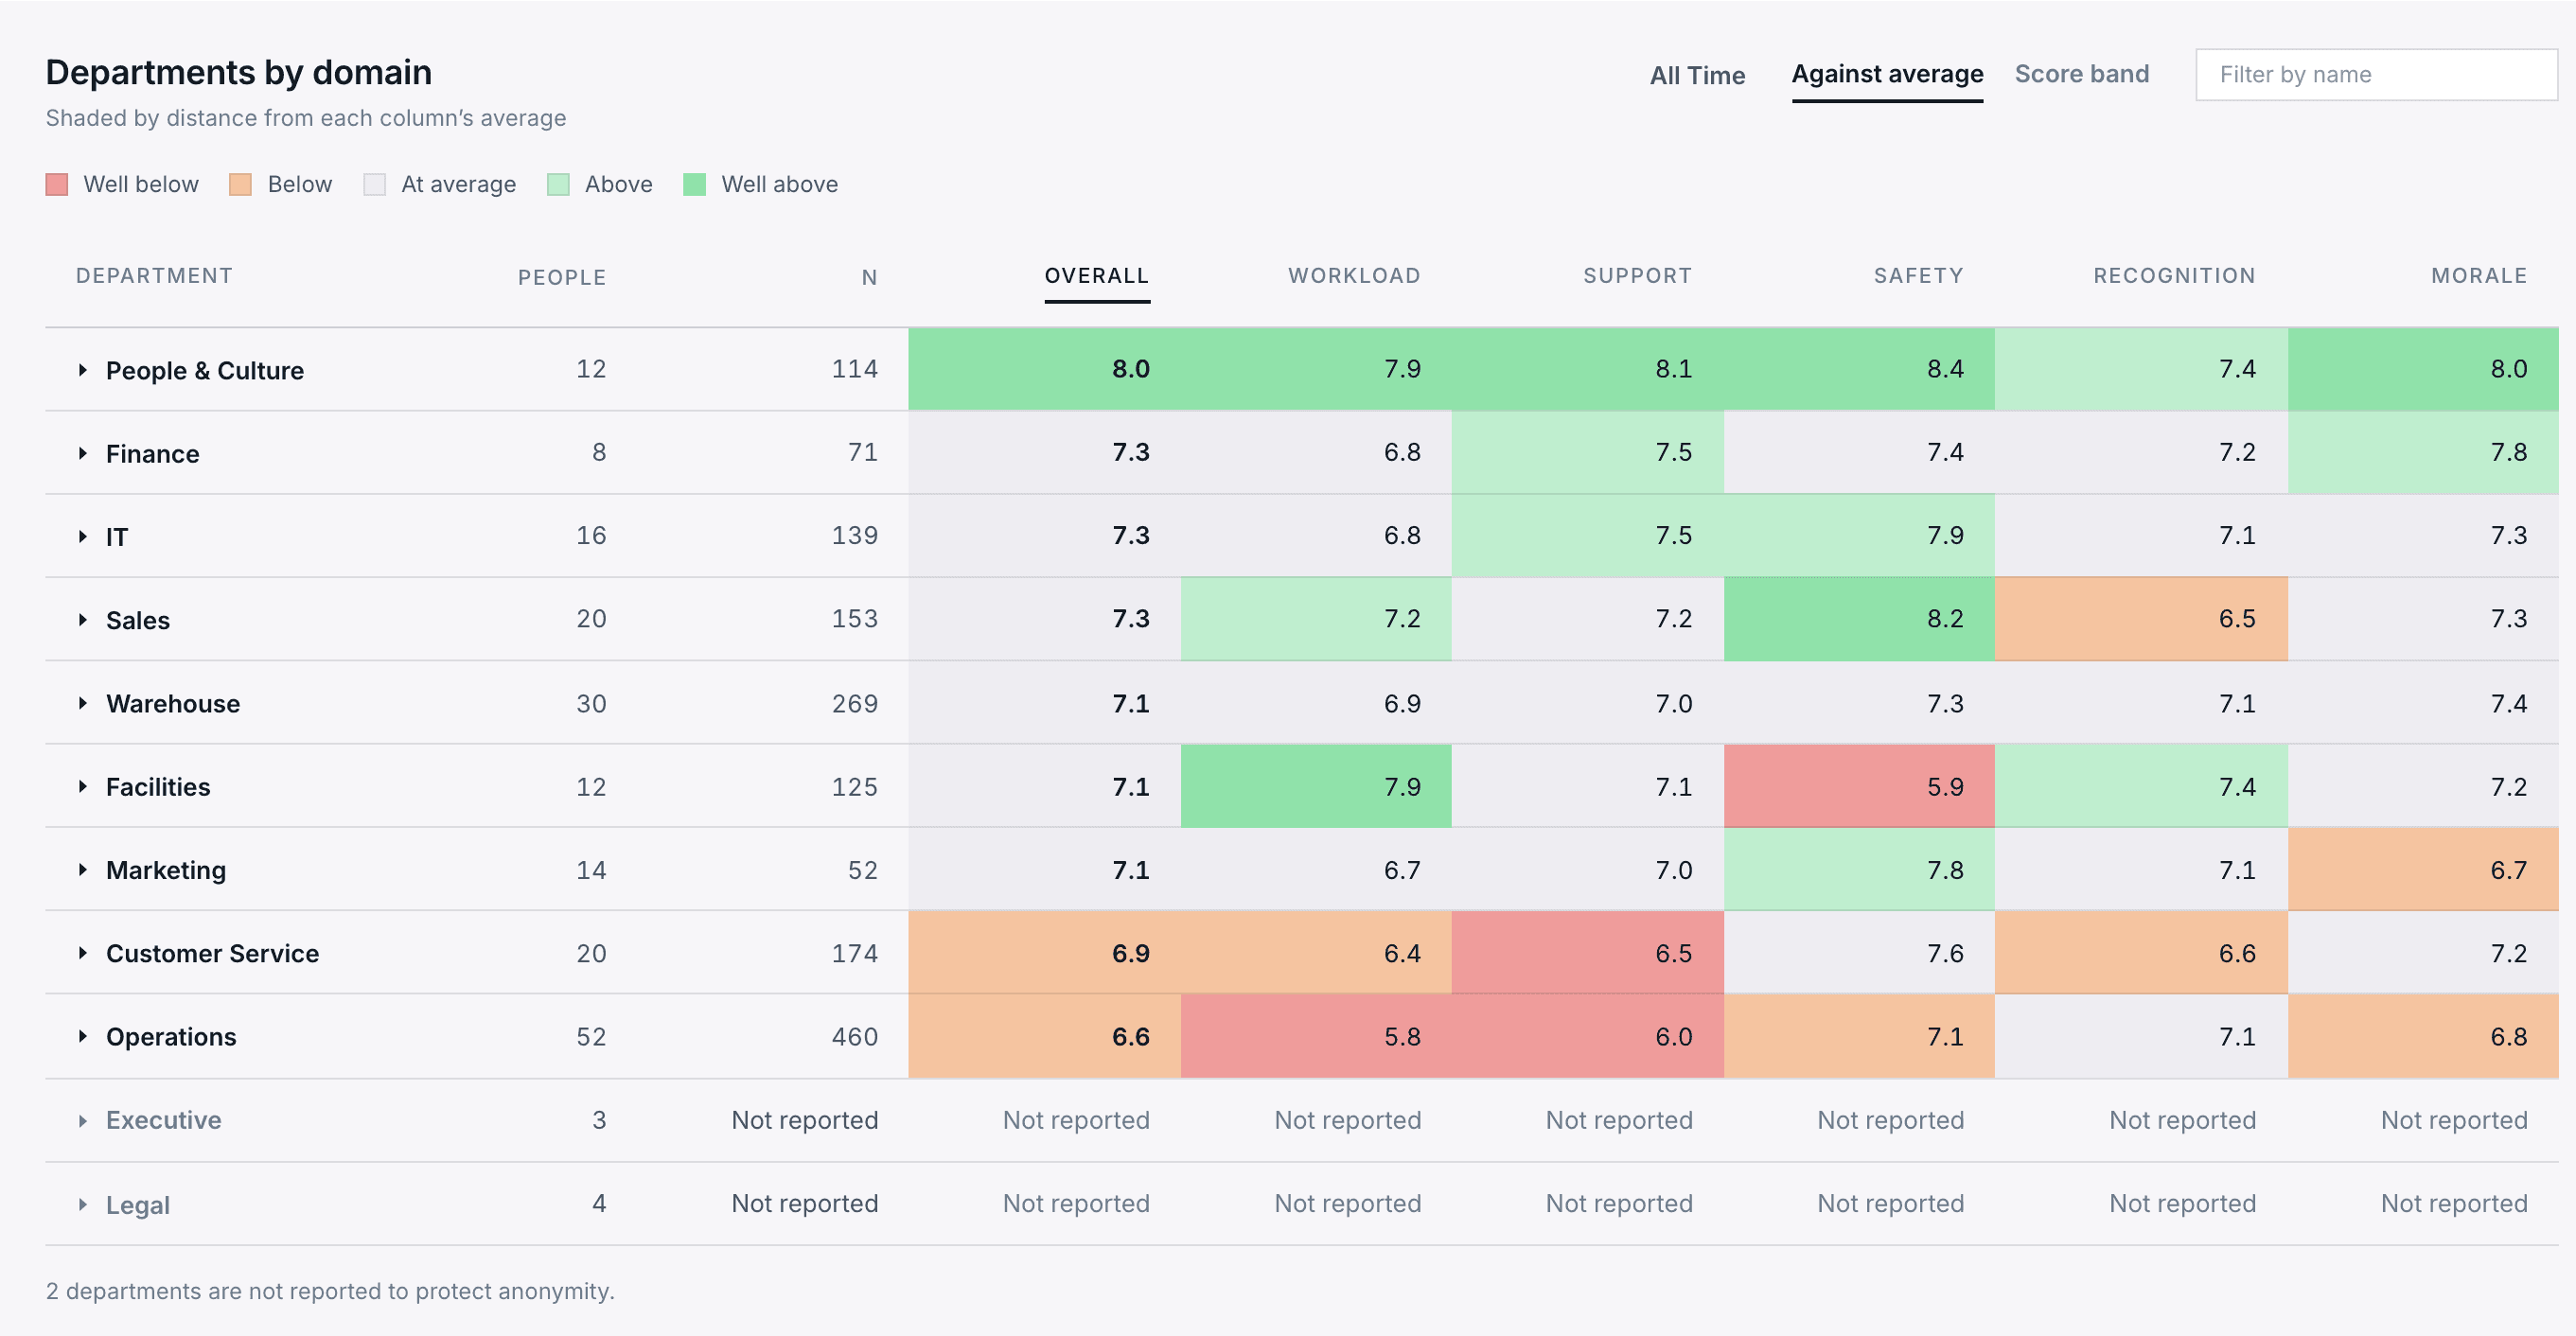
A response carries no employee reference. A department with fewer than five people, or fewer than five responses, is withheld.
■ 04. Read your scores
The Dashboard
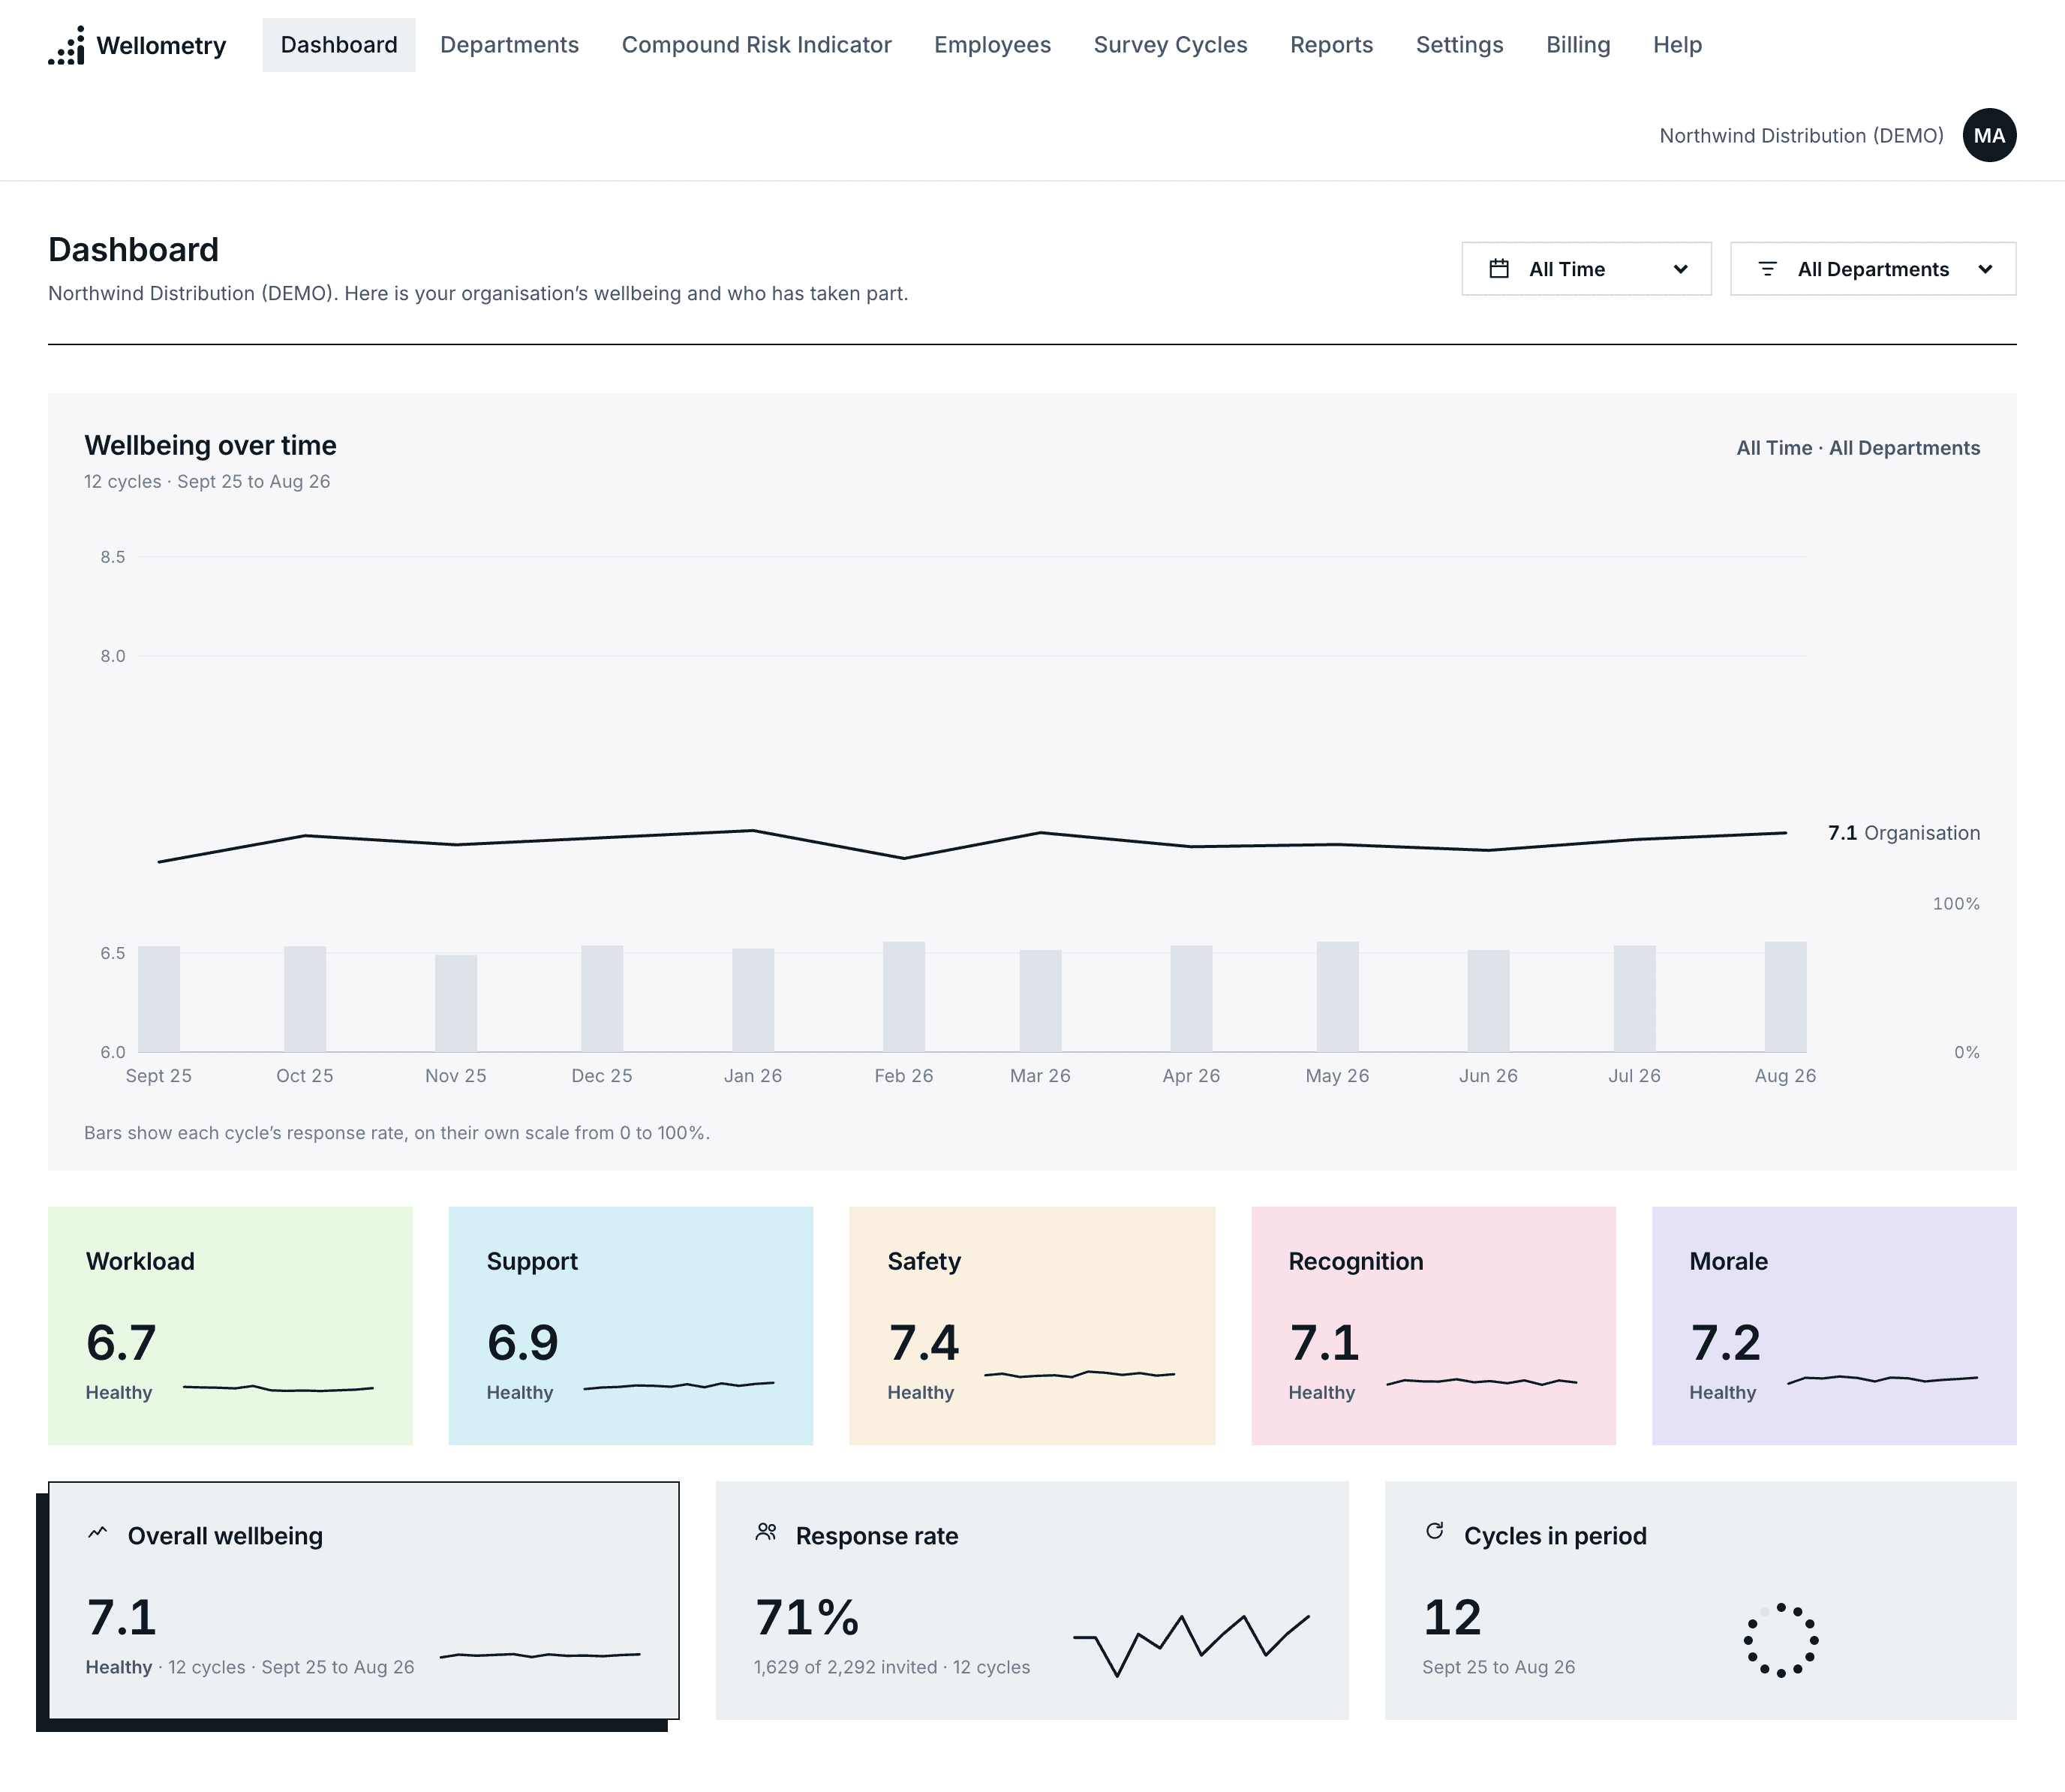
Answers reach the dashboard as they come in. Overall wellbeing is a single score with every previous cycle behind it, and each domain carries its own score, band and trend.
Department Heatmap
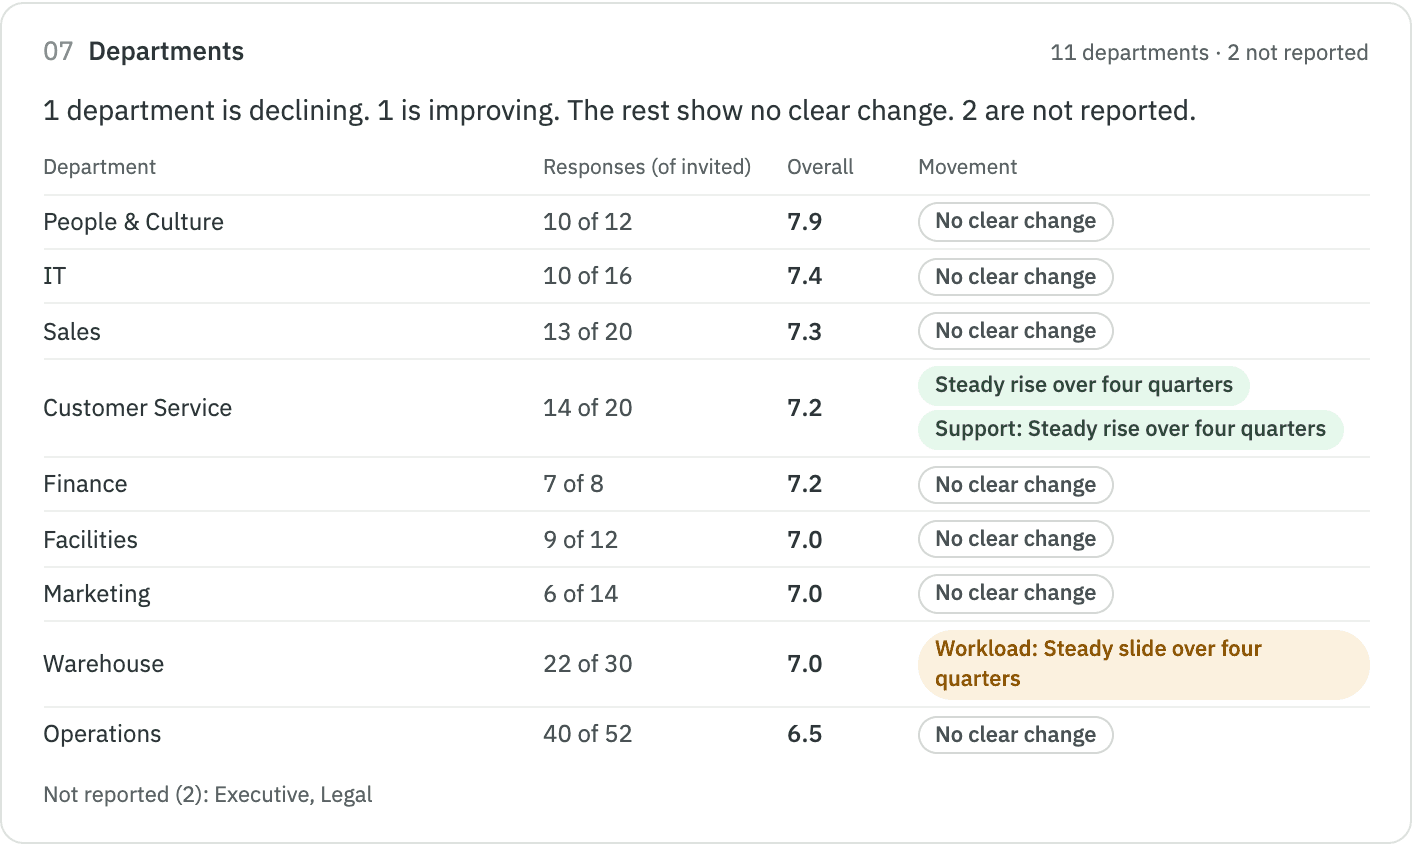
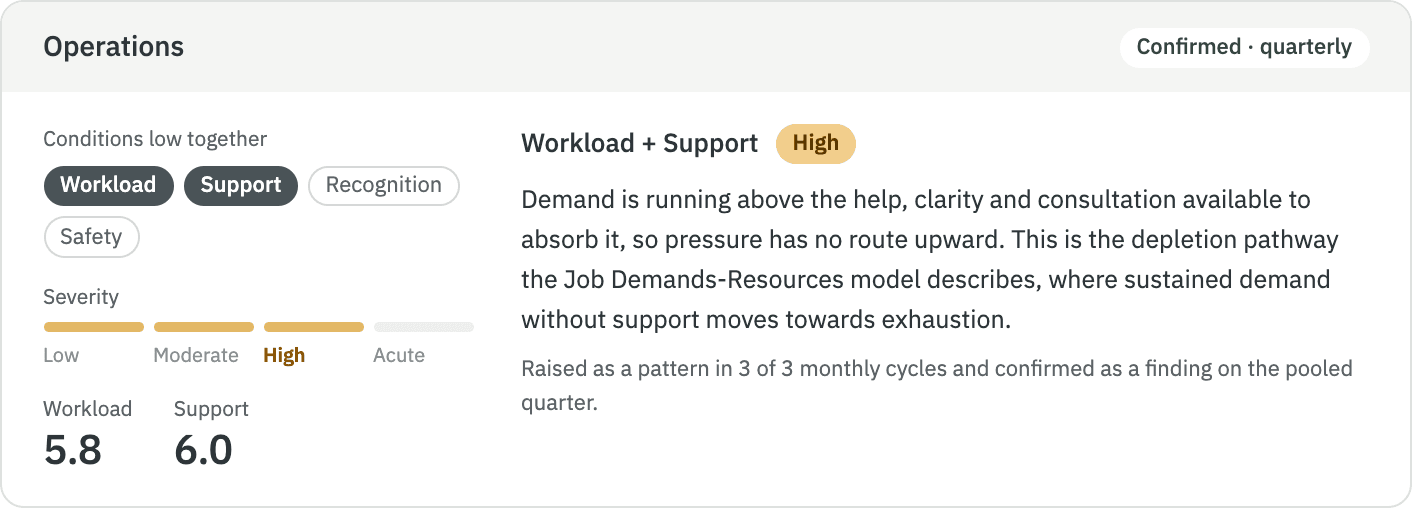
■ 05. Trend analysis
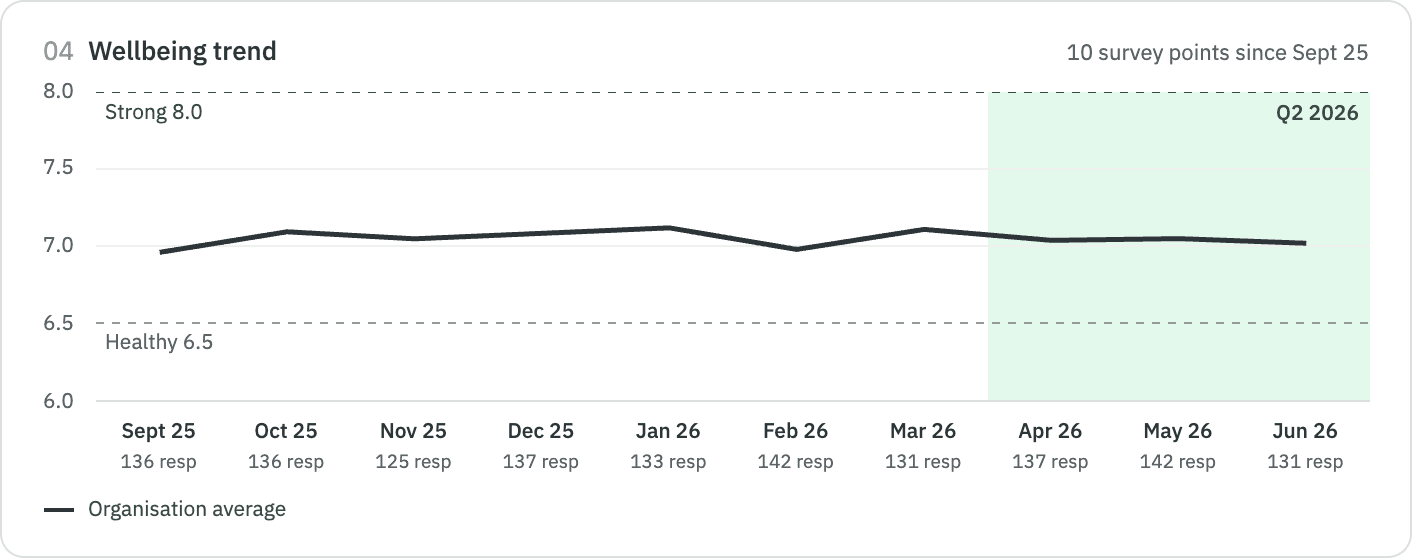
Signal pulled from the noise.
Algorithmic analysis that only reports change when it’s real.
■ 06. Reports
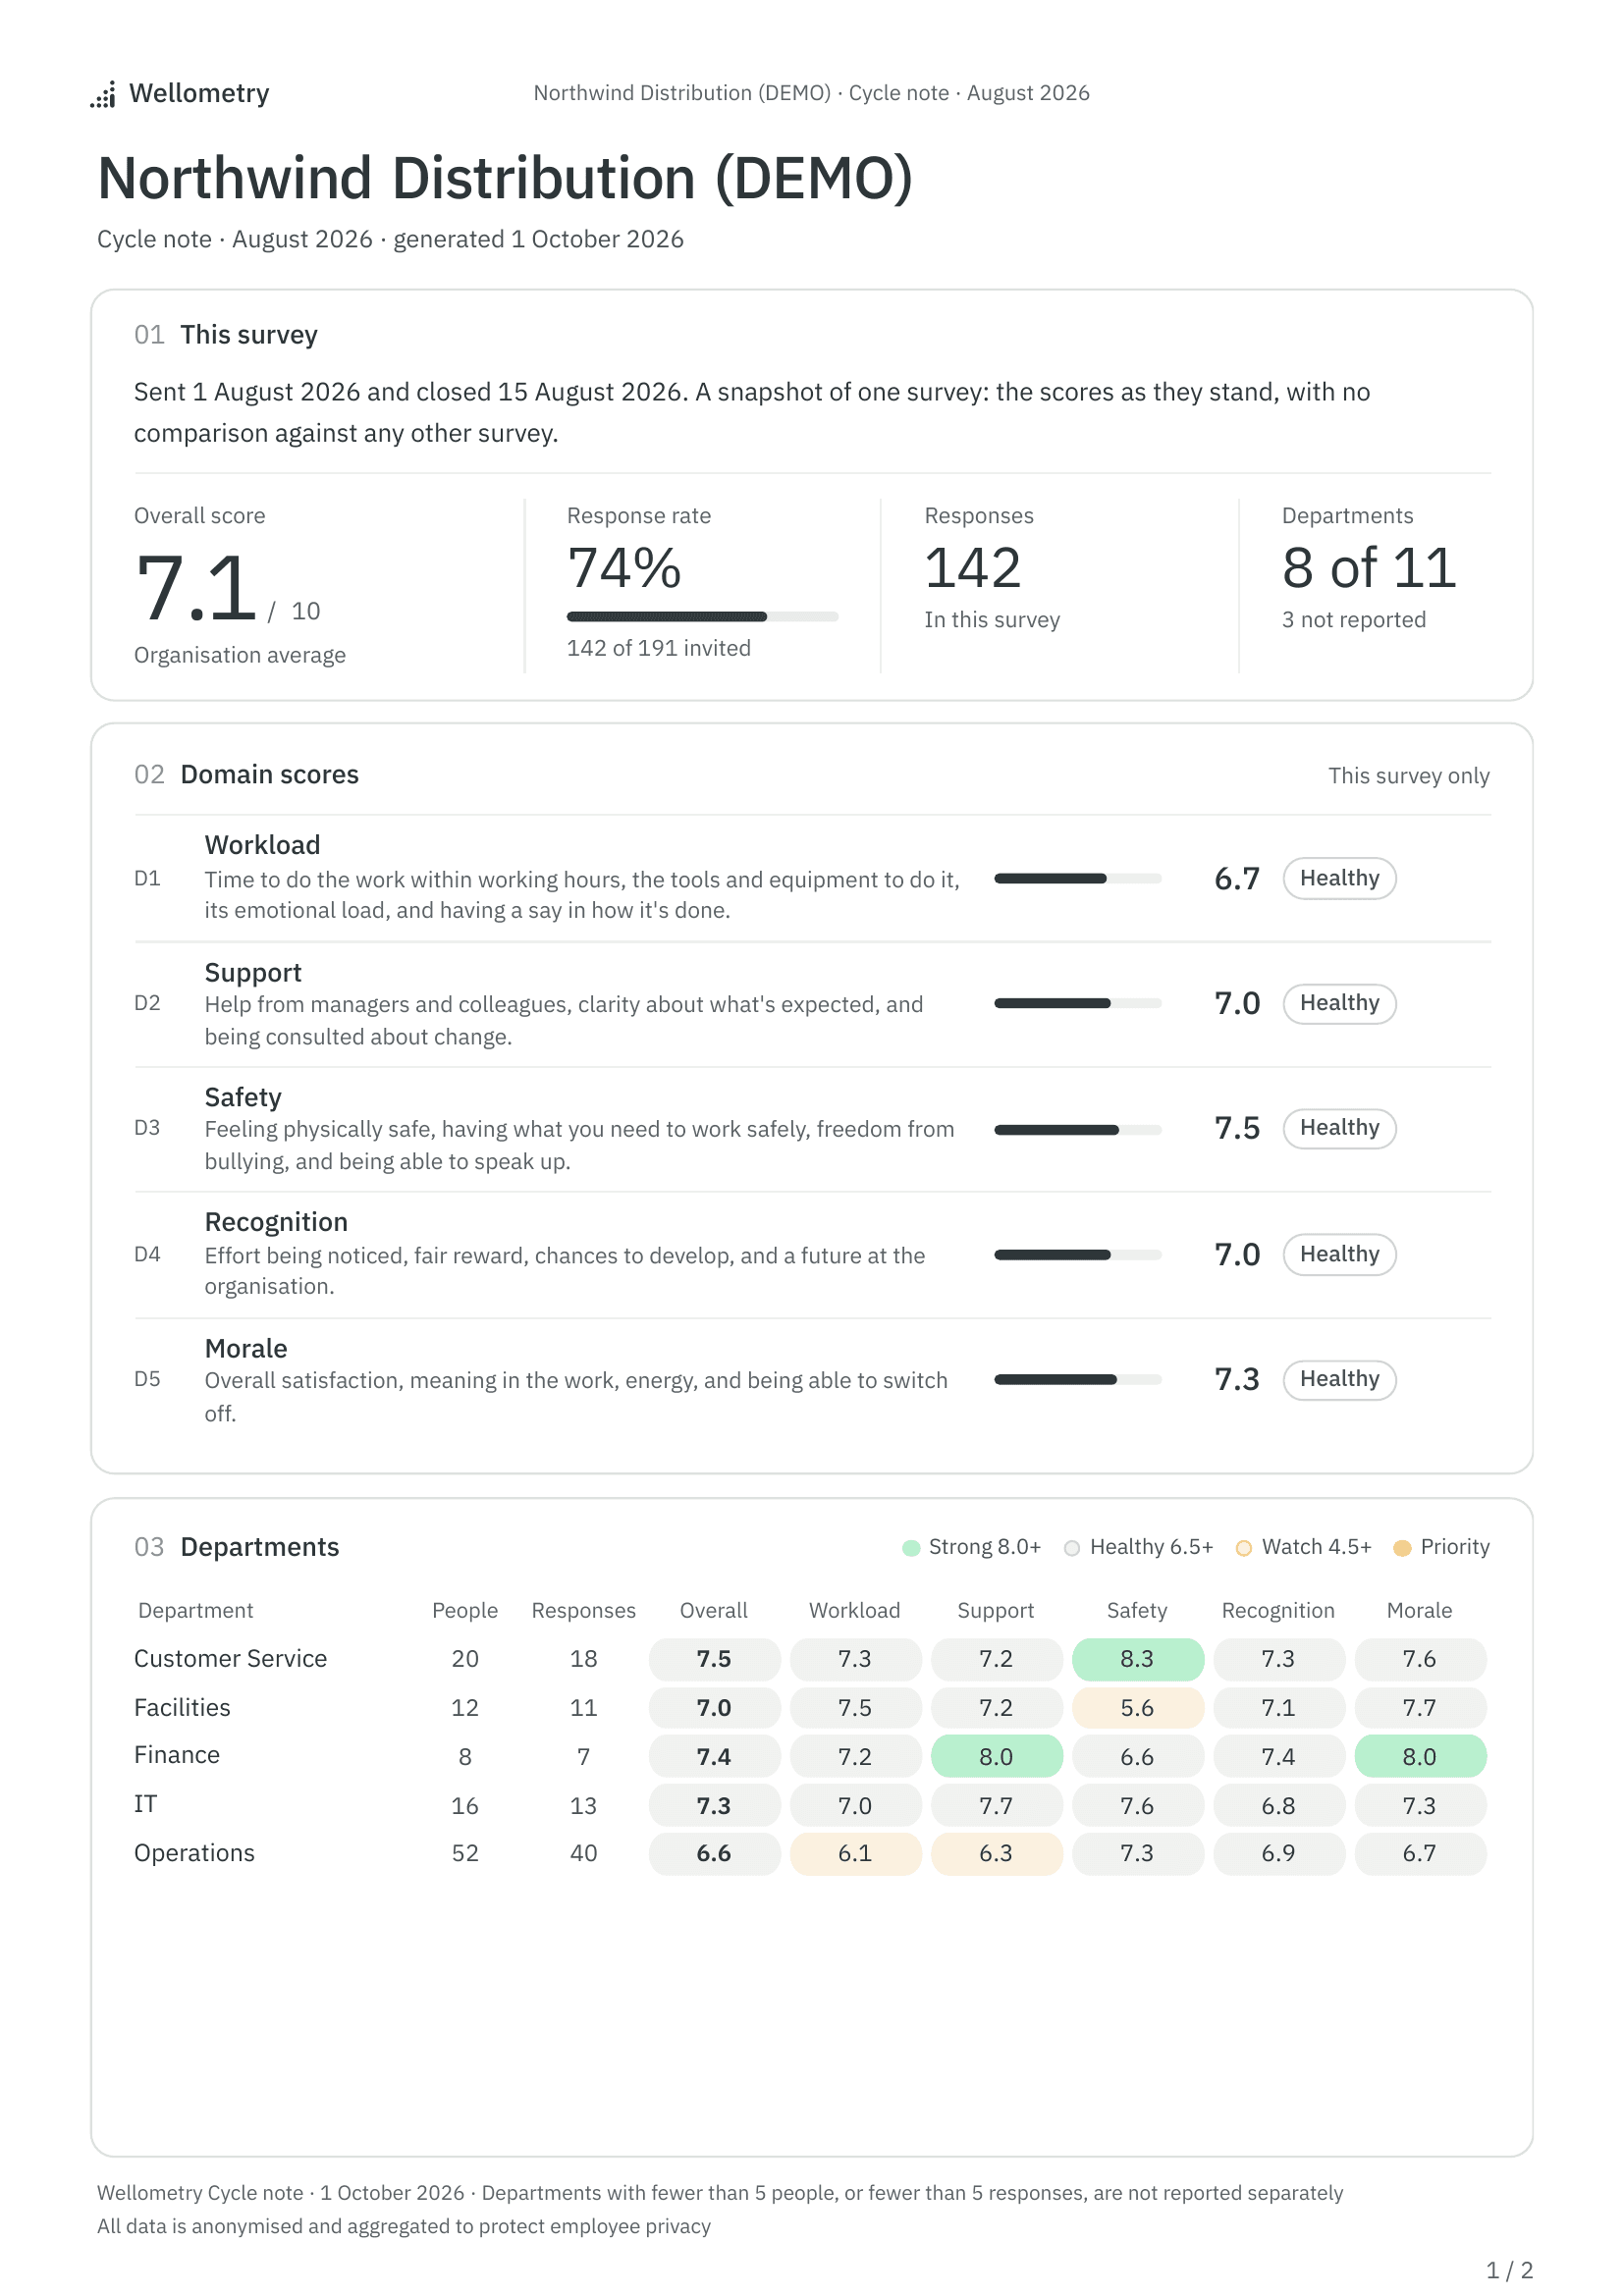
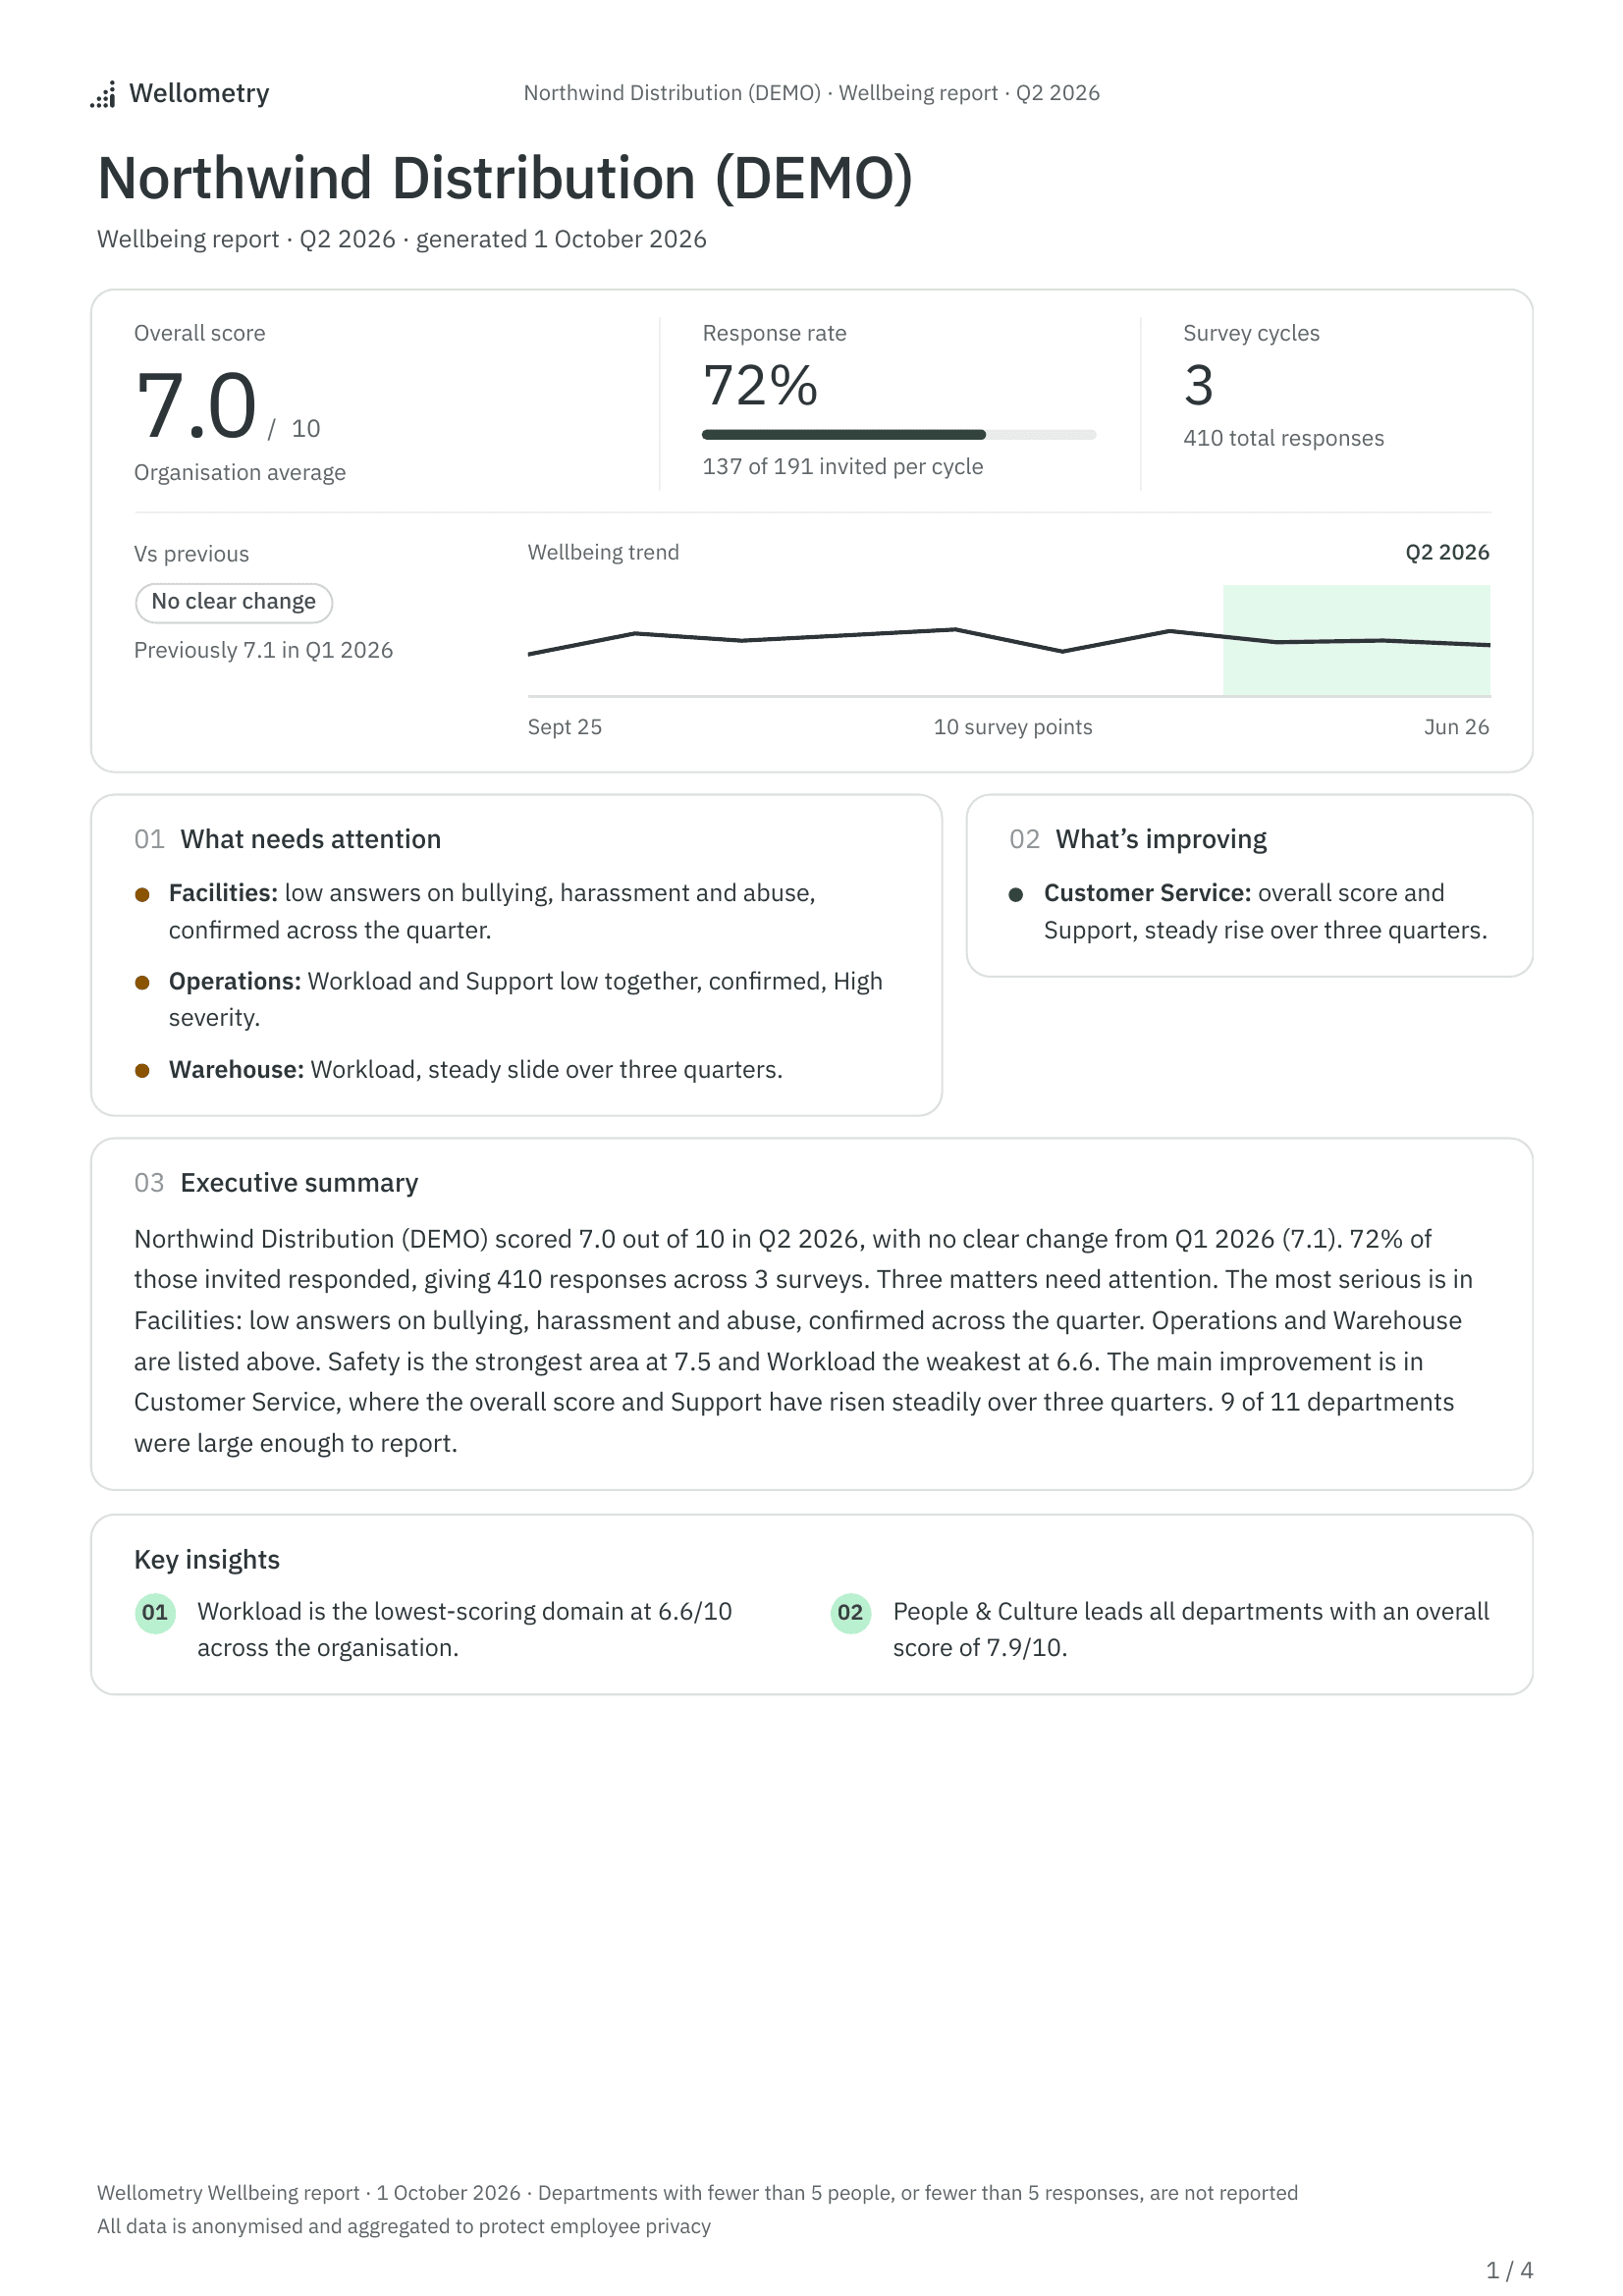
Get actionable reports
- A cycle note each month and a report each quarter
- Executive summary with key insights and focus areas
- Export to PDF, share with leadership and boards
Built on established frameworks
- HSE Management Standards
- Job Demands–Resources model
- WHO Healthy Workplace Framework
- PERMA
- CIPD Good Work Index
- Karasek's demand–control model
- Effort–reward imbalance model
Start measuring what matters